Get the Best of Data Leadership
Stay Informed
Get Data Insights Delivered
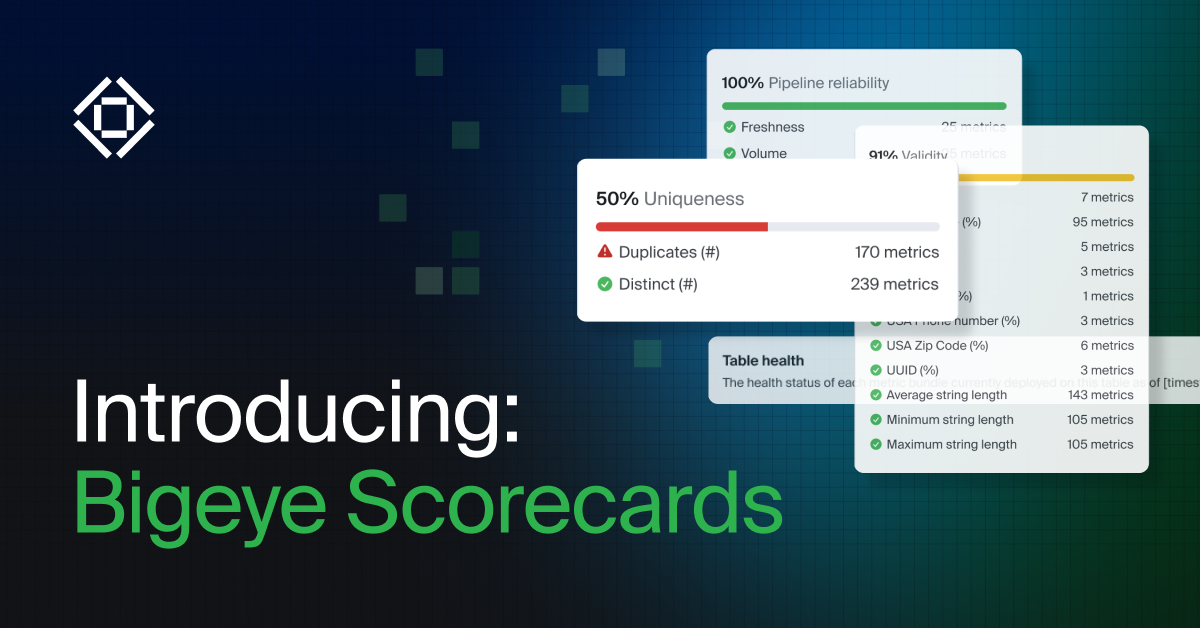
Elevate Your Enterprise’s Data Health Monitoring with Bigeye Scorecard
At Bigeye, we understand the challenges enterprises face in maintaining and reporting on data quality across vast, complex data ecosystems. That’s why we’re excited to introduce Scorecards, a powerful new feature designed to address the specific challenges our enterprise customers struggle with the most, providing a streamlined, efficient way to monitor and report on data health.
The Problem: Navigating Data Complexity in Enterprises
Enterprises deal with immense volumes of data, often spread across numerous databases, schemas, and tables. In addition to this, all of these objects are owned by individual teams with their own practices. Monitoring and understanding the health of this data can be overwhelming, especially when relying on traditional methods that require sifting through thousands of individual metrics and data quality checks.
Key challenges often include:
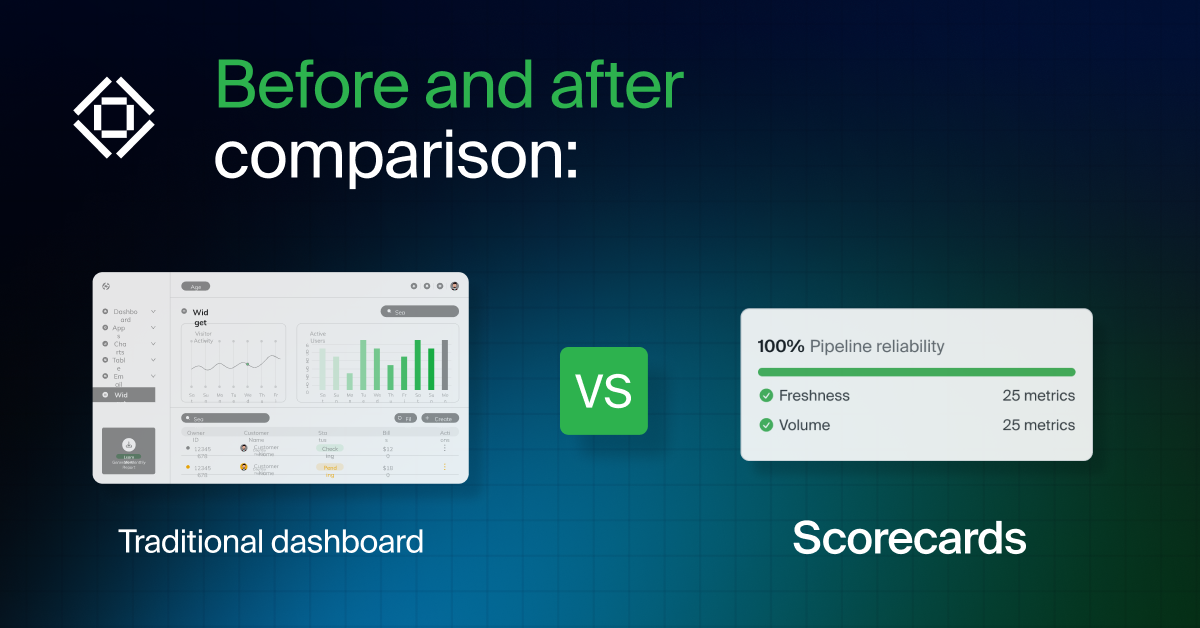
- Fragmented Data Views: Traditional dashboards often provide granular details but lack a summarized, comprehensive view, making it difficult to understand overall data health.
- Lack of Historical Context: Without historical data, it’s challenging to identify trends and recurring issues, hindering proactive data management.
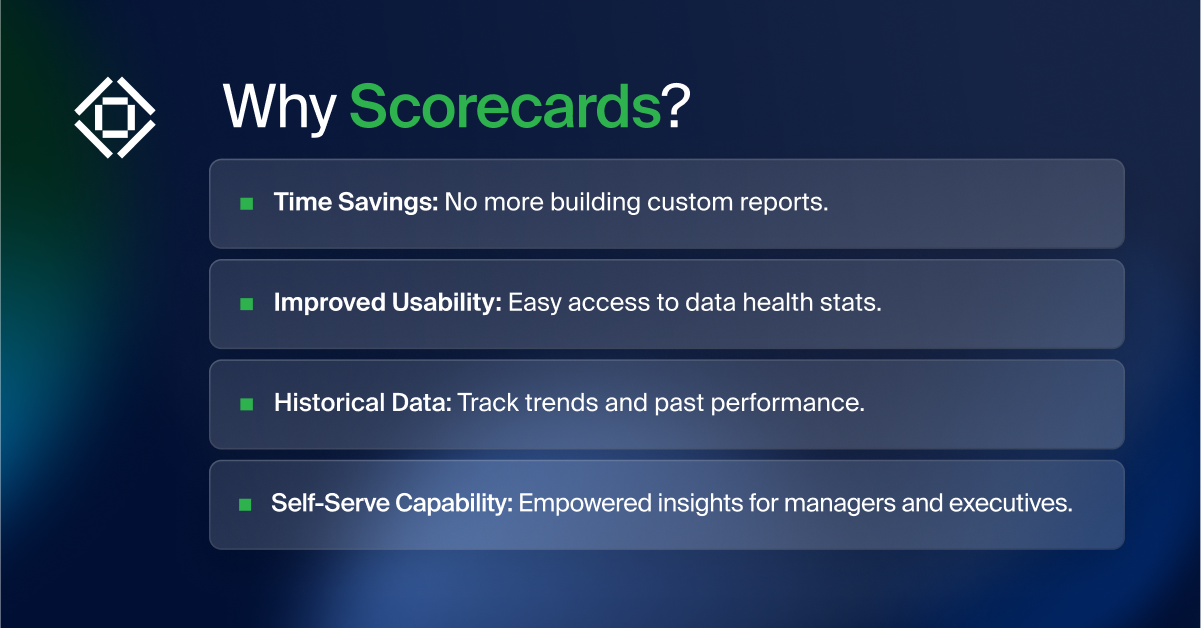
- Inefficient Reporting: Building custom reports to present data health to upper management is time-consuming and resource-intensive.
The Solution: Bigeye Scorecards
What Are Scorecards?
Scorecards offer a high-level overview of your data’s health by data quality category, with the added benefit of historical data. This enables enterprises to:
- Aggregate Reporting: View data health at various levels—database, schema, table, and column—without the need to navigate through individual data quality rules and reports.
- Perform Historical Analysis: Access historical data to track trends and identify recurring issues, allowing for proactive management.
- Unified Measurement Across the Data Pipeline: Ensure everyone, from data engineers to business analysts, sees the same data quality measures, ensuring consistency throughout the entire data lifecycle.
How Scorecards Benefit Enterprises
Scorecards transform data health monitoring for enterprises in several key ways:
1. Simplified Data Health Monitoring
Scorecards aggregate individual data quality measures into a summarized view, making it easier to understand the overall health of your data. This high-level perspective is crucial for managers and executives who need to make informed decisions quickly.
2. Enhanced Reporting Efficiency
With Scorecards, enterprises can eliminate the need for custom-built reporting solutions. This feature provides self-serve access to comprehensive data health summaries, saving valuable time and resources. For example, a VP can quickly generate a data health summary for executive meetings without having to wait on numbers from their data team.
3. Proactive Data Management
The inclusion of historical data allows enterprises to identify trends and recurring issues, enabling more proactive management of data health. This historical perspective is something that other existing solutions lack.
4. Enterprise-Focused Design:
Scorecards were built based entirely on customer feedback and the specific needs of large organizations, ensuring it meets the requirements of enterprise data management.

Get Started with Scorecards Today
We invite you to experience the transformative power of Scorecards. Join our upcoming webinar to see Scorecards in action and learn how they can elevate your data health monitoring to new heights. Or, request a demo here.
Monitoring
Schema change detection
Lineage monitoring
.png)
Adrian Vidal